
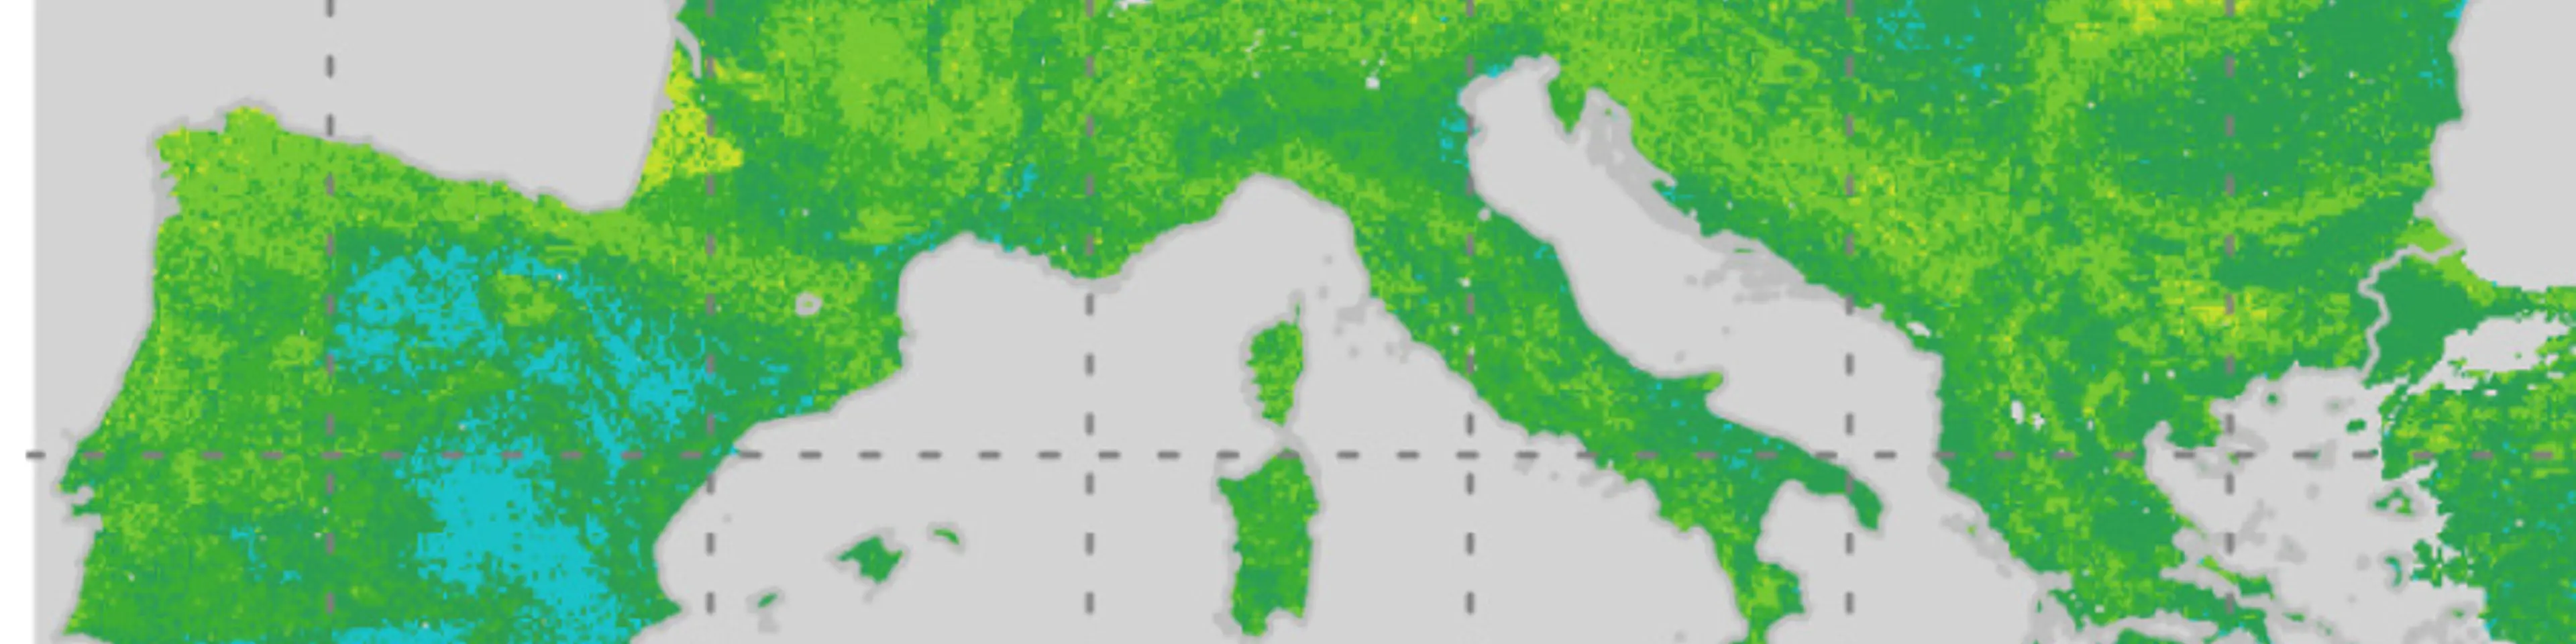


A soil map can score well on accuracy and still be unsuitable for its intended use. With an increasing number of digital soil maps available, how can users determine which map best meets their needs? A new paper in Geoderma by ISRIC introduces a comprehensive framework to help soil information and data users assess the quality and suitability of continental or global soil maps, going beyond traditional accuracy measures to determine whether a map is fit for their purpose.
Global digital soil maps of pH, texture, carbon and many other properties are now freely available of whole continents often at very fine resolution. For anyone who relies on soil information, whether for land-use planning, modelling of crops, water or carbon, a practical question is raised: which map should be used.
Why accuracy figures are not enough
Soil maps are usually compared on a few accuracy statistics and calculated at the locations where soil was sampled. It provides only a snapshot of a certain area of land.
These statistics are useful, but they describe the map only at specific points and show little about the rest of the map, such as patterns of the landscape, the regions that lie outside where the model was trained, or whether its level of detail is useful. This type of additional information is significant because sometime the surrounding environment provides vital information for decision making.
A set of questions rather than a single score
The framework, developed by Laura Poggio, David Rossiter and Niels Batjes, looks at where soil predictions can be trusted, whether their precision meets the needs of an application, how realistic their spatial patterns are, and which soil-forming factors drive them.
The framework asks a series of questions of a map, using three maps in Europe as the case study, each answered with a dedicated method:
Where can the predictions be trusted? Areas whose environmental conditions are unlike anything in the training data are flagged as areas where the model is extrapolating.
Is the map precise enough for a specific application? Variable resolution maps merge pixels wherever the uncertainty is too large for a chosen threshold, showing at what resolution decisions can be made.
Are the maps spatial patterns realistic? The spatial structure of the map, and of its errors, is analysed region by region across area of interest (i.e., Europe in this case study).
What drives the predictions? The contribution of each environmental factor, such as climate, relief or parent material, is mapped and can be compared with expert knowledge on soil formation.
What the European case showed
The framework was tested on three maps for Europe, one publicly available and two experimental. The researchers compared the predictions of soil pH, bulk density and sand content, examining not only their accuracy but also their uncertainty, spatial patterns, model applicability and the environmental factors influencing predictions.
The three maps differ in resolution (20 m and 100 m) and in the environmental data used to make them. One map is based on embeddings from an Earth-observation foundation model. The three maps have very similar accuracy figures, but they differed clearly on every other aspect assessed. The one map based on embeddings performed close to the two others, but its predictions cannot be traced back to soil-forming factors, which limits its use where interpretation matters.
The findings demonstrate that maps with similar accuracy can differ substantially in their reliability and suitability for specific applications. Importantly, higher spatial resolution does not necessarily mean better or more reliable soil information. As the authors put it, resolution is a property of the grid, not of the soil information: a finer pixel does not mean that finer soil variation has been captured.
No single best map
Rather than ranking maps from best to worst, the framework helps users evaluate which products are fit for their intended purpose, supporting more informed decisions in land-use planning, environmental modelling and soil management. A map that is adequate for one application may not be adequate for another, even with the same accuracy and the same pixel size.
The paper indicates which aspects matter most for different types of application, and which reduced set of checks to run when computing resources are limited. The workflow of this framework is built with open-source tools, containerised and documented.
Read the paper
Poggio, L., Rossiter, D.G., Batjes, N.H. (2026). When and how to use a map: characterising and assessing fitness for use of global and continental Digital Soil Mapping products beyond point-based accuracy metrics. Geoderma 475, 118101. https://doi.org/10.1016/j.geoderma.2026.118101
The paper is open access.
The work was partly supported by the CUP4SOIL and ORCaSa projects and the AI Institute for Land,Economy, Agriculture & Forestry.