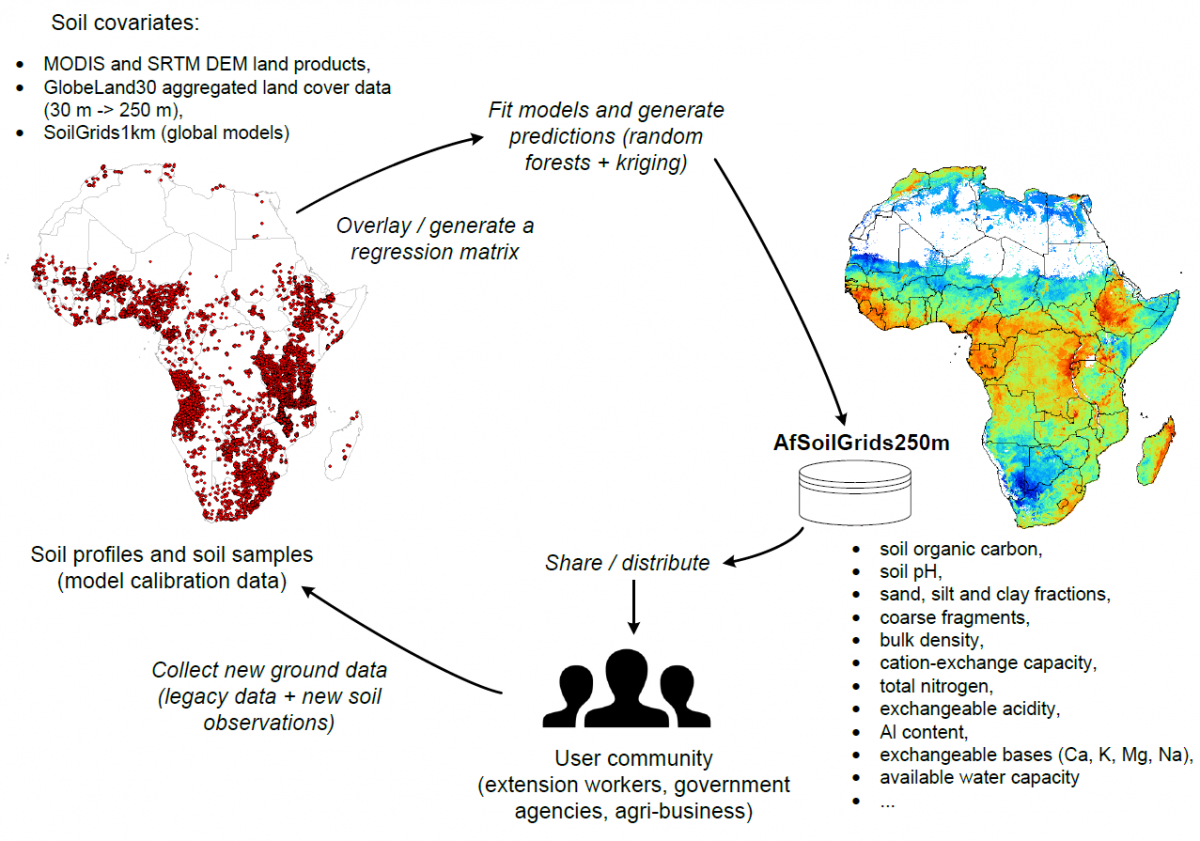
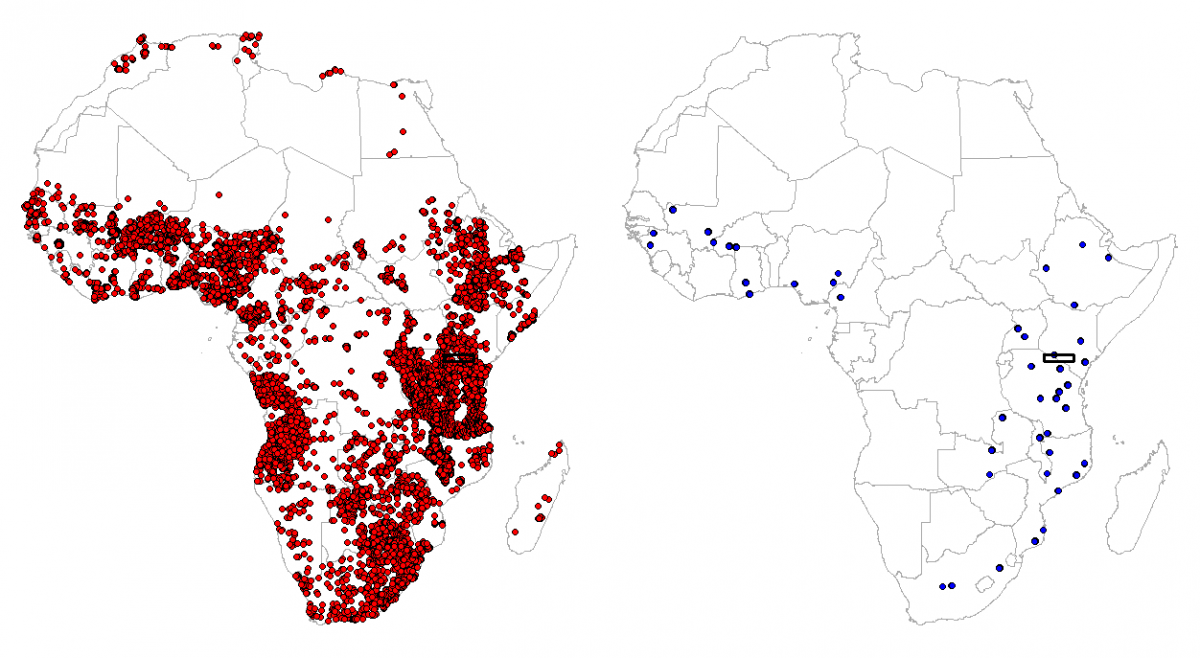
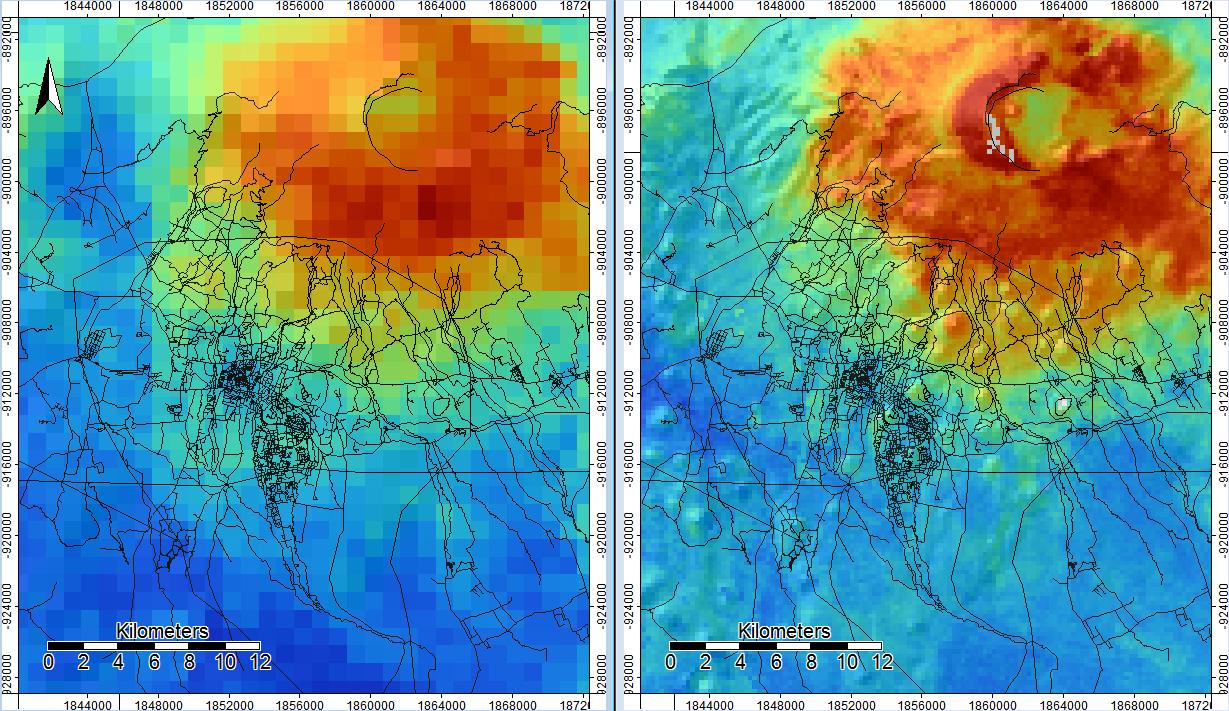
Over the period 2008–2014, the AfSIS project has compiled two soil profiles / samples datasets: the Africa Soil Profiles database [Leenaars, 2014] holding legacy soil profiles data and the Sentinel Sites database [Vagen et al, 2010] holding newly collected topsoil data, jointly consisting of ca. 28 thousand sampling locations (or over 85 thousand samples). Using these soil point observations & measurements and an extensive collection of global (SoilGrids1km) and continental (Africa) environmental covariates, ISRIC - World Soil Information, in collaboration with The Earth Institute, Columbia University, World Agroforestry Centre, Nairobi and the International Center for Tropical Agriculture (CIAT), has produced (February 2015) predictions of soil properties — organic carbon, pH, sand, silt and clay fractions, coarse fragments, bulk density, cation-exchange capacity, total nitrogen, exchangeable acidity, exchangeable bases (Ca, Mg, K, Na) and extractable aluminium — for the whole African continent at 250 m spatial resolution at either two or six standard soil depths. The predictions are obtained using an automated mapping framework (3D regression-kriging based on random forests). Compressed GeoTiffs of the soil property maps, together with all metadata are available for download from here. A web-mapping interface to the maps is available via: http://af.soilgrids.org/. Read more about how were these maps made.


Background

Data download and metadata
For download of the data related to this project, please see the 'Related Links' section at the bottom of this page.
The AfSIS project has been funded by the Bill and Melinda Gates Foundation and the Alliance for a Green Revolution in Africa (AGRA). To learn more about the AfSIS project, visit the project website Africasoils.net and/or the AGRA website. Please cite as:
Hengl T, Heuvelink GBM, Kempen B, Leenaars JGB, Walsh MG, Shepherd KD, et al. (2015) Mapping Soil Properties of Africa at 250 m Resolution: Random Forests Significantly Improve Current Predictions. PLoS ONE 10(6): e0125814. doi:10.1371/journal.pone.0125814
This data set is available under the Attribution-NonCommercial International CC BY-NC. This means that: you are free to share (copy and redistribute the material in any medium or format) and adapt (remix, transform, and build upon the material), as long as you give appropriate credit and provide a link to the SoilGrids.org homepage; you may not use these materials for commercial purposes.
Inputs: Africa Soil Profiles database (AfSIS), Africa Sentinel Sites soil database (AfSIS) Africa Soil covariates (250 m), SRTM DEM and derivatives (250 m), GlobLand30 land cover data (250 m), SoilGrids1km predictions.
Period (temporal coverage approximate): 1950–2012.
Spatial resolution (covariates): 250 m and 1 km.
Producers: ISRIC - World Soil Information, in collaboration with The Earth Institute (Columbia University), ICRAF - World Agroforestry Centre, Nairobi and the International Center for Tropical Agriculture (CIAT).
Data license (IP policy): Attribution-NonCommercial International CC BY-NC
Specifications AfSoilGrids250m
Output maps comply with the GlobalSoilMap.net/specifications (except for uncertainty quantification and spatial resolution, which has been set at 250 m). Each layer (one compressed GeoTiff) provides predictions of one of the soil properties at one of the standard depths. Maps of uncertainty (upper and lower limits of 90% prediction limits) are not provided. Only a summary accuracy measures (RMSE) is provided (see summary Table). Two examples illustrate the naming convention:
ORCDRC_T__M_sd1 - indicates predicted organic carbon content in permilles ("ORCDRC") for the first standard depth (0?5 cm) using a tiling system ("T");
EMGX_T__M_xd1 - indicates predicted exchangeable Mg in soil for the first non-standard depth (0?20 cm);
Each GeoTiff comes with a metadata XML file (following the Inspire metadata scheme), so that users are advised to obtain and use both the data and metadata files together:
The six standard depth intervals in the GlobalSoilMap.net/specifications are:
sd1: 0-5 cm
sd2: 5-15 cm
sd3: 15-30 cm
sd4: 30-60 cm
sd5: 60-100 cm
sd6: 100-200 cm
The two ‘non-standard’ depth intervals, as sampled at the AfSIS sentinel sites, are:
sx1: 0-20 cm
sx2: 20-50 cm
Typical GDALInfo output is:
rows 31505
columns 29501
bands 1
lower left origin.x -3977625
lower left origin.y -4321625
res.x 250
res.y 250
driver GTiff
projection +proj=laea +lat_0=5 +lon_0=20 +x_0=0 +y_0=0 +datum=WGS84 +units=m +no_defs
file af_ORCDRC_T__M_sd1_250m.tif
Spatial reference AfSoilGrids250m
Because the interpolation is done in 3D, the grid cells are three dimensional blocks (or voxels) with different thicknesses for each standard depth (e.g. 250 m by 250 m by 5 cm for the first layer; 250 m by 250 m by 10 cm for the second). In all cases, the predictions refer to the centre of the voxel (e.g. "sd1" refers to a depth of 2.5 cm, while “sd2” refers to 10 cm depth).
All maps are projected in the pan-African equal area coordinate system with the following proj4 string:
"+proj=laea +lat_0=5 +lon_0=20 +x_0=0 +y_0=0 +units=m +ellps=WGS84 +datum=WGS84"
Predictions have been made only for areas with vegetation cover. i.e. all deserts and shifting sand areas were excluded using a soil mask. We derived the soil mask for Africa by using the GlobeLand30 data set, by removing all pixels that have >10% of bare land (class 90 in GlobeLand30) and/or >30% of water cover (class 60 in GlobeLand30). The non-vegetated land areas were masked out because soil prediction models could not reliably be obtained from the very few soil point observations non-vegetated land. Extrapolation of models calibrated on vegetated land would lead to unrealistic and erroneous predictions.

Mapping accuracy AfSoilGrids250m
The accuracy of the maps (random forests part of the model) was assessed using 5-fold cross-validation, with model re-fitting, and reported using RMSE and % variance explained. The latter is defined as 1-MSE/sigma-square, where MSE is the mean square error at cross-validation points and sigma-square is the variance of the target variable. Some soil properties were log-transformed prior to prediction using regression kriging. In such cases the maps are the back-transformed regression kriging maps, but the % variance explained was derived in the transformed (trans-Gaussian) space which differ from the % variance explained in the original space. The figure and table below shows scatter plots and summary statistics of cross-validation results.

Example of a mapping accuracy assessment plot for soil organic carbon, pH and bulk density (obtained with 5-fold cross-validation).
|
Code |
Soil property name |
Units |
Sample size |
Range |
RMSE |
% variance |
|
ORCDRC |
Organic carbon |
g kg-1 |
64,010 |
0.9–42‰ |
10.6 |
61.3 |
|
PHIHOX |
Soil pH in H2O |
- |
68,458 |
4.4–8.7 |
0.67 |
66.9 |
|
CRFVOL |
Coarse fragments volumetric |
m3 100 m-3 |
39,206 |
7–90% |
18.4 |
20.3 |
|
SNDPPT |
Soil texture fraction sand |
g 100 g-1 |
55,578 |
7–94% |
15.9 |
61.1 |
|
SLTPPT |
Soil texture fraction silt |
g 100 g-1 |
54,164 |
1–47% |
8.3 |
56.1 |
|
CLYPPT |
Soil texture fraction clay |
g 100 g-1 |
54,167 |
3–73% |
13.7 |
52.4 |
|
BLD |
Bulk density (fine earth) |
kg dm-3 |
8732 |
0.9–1.9 |
0.14 |
70.4 |
|
CEC |
Cation Exchange Capacity |
cmol+ kg-1 |
47,875 |
1.2–57 |
7.9 |
66.3 |
|
NTO |
Total nitrogen |
g kg-1 |
50,997 |
0.1–3.1‰ |
0.69 |
61.0 |
|
ALUM3S |
Extractable Aluminium |
mg kg-1 |
18,055 |
150–1800 |
160 |
86.3 |
|
EACKCL |
Exchangeable acidity |
cmol+ kg-1 |
24,242 |
0–6.4 |
1.30 |
77.3 |
|
ECAX |
Exchangeable Calcium |
cmol+ kg-1 |
65,158 |
0.1–46 |
12.7 |
67.2 |
|
EXKX |
Exchangeable Potassium |
cmol+ kg-1 |
64,518 |
0.01–2.4 |
0.60 |
58.6 |
|
EMGX |
Exchangeable Magnesium |
cmol+ kg-1 |
63,261 |
0.04–15 |
2.5 |
60.0 |
|
ENAX |
Exchangeable Sodium |
cmol+ kg-1 |
42,986 |
0–8.3 |
3.6 |
46.7 |
|
EXBX |
Sum of exchangeable bases |
cmol+ kg-1 |
64,270 |
0.31–66 |
11.0 |
68.8 |
Updates and improvements
The Africa soil property maps at 250 m resolution were produced using an automated spatial prediction framework, which has been fully documented and allows for reproducible research. The maps will be regularly updated and improved using an extended list of covariates and improved spatial prediction methods. It is therefore important to refer to the date of access when using these maps for modelling purposes, as there will be differences between different versions of the maps. Before using these maps for decision making purposes, please read the general disclaimer. If you discover any inconsistencies, gross errors or artifacts please report these to the SoilGrids production team.
We are aware of multiple artifacts and inconsistencies in the version of AfSoilGrids250m predictions released on February 10th 2015 and are working on updating maps in periods of less than 3 months. A detailed quality control report can be downloaded from here.

Possible uses of these maps include, but are not limited to:
Soil-environmental modelling, land degradation studies, soil-landscape planning, biodiversity assessment (continental scale or country scale models);
General assessment of soil characteristics (baselines) for the African continent (e.g. total carbon stock) and further planning of soil surveys / new soil sampling campaigns;
Downscaling and/or merging of coarse resolution maps with finer resolution maps (100 m, 30 m).
